Your numbers already exist. They are buried in the software you pay for.
Vivid Software builds the layer that gets them out. We move companies onto new finance systems, connect the systems they keep to the reports and tools that need the data, and build and run software of our own.
Behind budget. Operating income is $31,200 under budget for October so far. Sales are $40,000 short, and production cost $27,700 more than standard. The bank holds 2.8 weeks of payments, and the 13-week forecast never drops below $1,335,000.
Profit and loss against budget
Actual
Budget
Var.
Revenue
1,940,000
1,980,000
(40,000)
Cost at standard
1,445,300
1,475,100
+29,800
Cost over standard
27,700
0
(27,700)
Selling and admin
214,300
221,000
+6,700
Operating income
252,700
283,900
(31,200)
Cash in bank
$2,410,000
Low point $1,335,000, week of Jan 4
Conversion cost a unit
$10.57
$0.60 over the $9.97 standard
Needs a decision
$9,910Line 2, fabrication and weld, cost $15.23 a unit to run against a $13.50 standard. It ran at 88% of its standard rate last week, the fifth week in a row under 95%. Find what is slowing line 2 before adding overtime.
$5,088of material was scrapped over the 2.5% allowance. Fabrication and weld scrapped 4.9% of what it was issued. Sort the weld scrap tags by part number this week.
$198,000of receivables are more than 60 days old. Call those customers before shipping them more on credit.
Saltmarrow Kitchen
Monday report
Week of Mon 12 Oct to Sun 18 Oct
Sample: a three-restaurant group
A good week. Sales beat budget by 3.7% and profit finished $490 ahead. Cash covers 2.1 weeks of payments, and the 13-week forecast never drops below $414,000. Two costs and one bill need a decision.
Profit and loss against budget
Actual
Budget
Var.
Net sales
221,860
214,000
+7,860
Food and beverage
66,537
61,700
(4,837)
Labor, all in
70,633
68,900
(1,733)
Occupancy
16,800
16,800
0
Other operating
30,200
29,400
(800)
Operating profit
37,690
37,200
+490
Cash in bank
$486,000
Low point $414,000, week of Jan 11
Net sales, 13 weeks
$222K
$2,560 over the week before
Needs a decision
$4,109Food cost ran 30.0% against 28.1% on the recipes. Count seafood tonight. Sunday alone ran 2.9 points over.
$1,004Westside spent 34.0% of sales on labor. Budget is 32.2%. Cut late-night hours first; it carries the most labor per dollar.
$8,200of bills are past 30 days, $1,900 of it one seafood invoice due Aug 14. Pay that invoice this week.
Corvalt Mechanical
Monday report
October to date, through Sun 18 Oct
Sample: an HVAC and plumbing company
Slightly behind. Revenue is $16,740 under budget for October so far and overhead is $6,400 over, so operating income trails by $6,340. Technicians billed 69.2% of their paid hours against a 75% target. With 3.9 weeks of payments in the bank, the forecast never drops below $912,000.
Profit and loss against budget
Actual
Budget
Var.
Revenue
701,260
718,000
(16,740)
Labor and parts
367,300
384,100
+16,800
Office and trucks
198,400
192,000
(6,400)
Operating income
135,560
141,900
(6,340)
Cash in bank
$1,184,000
Low point $912,000, week of Jan 11
Utilization, 13 weeks
69.2%
5.8 points under the 75% target
Needs a decision
$192an hour is what T-30 billed this month, against $258 for the team, on 57% of paid hours. Send T-30 on ride-alongs with T-04 before hiring.
76of 134 return trips were for a part that was not on the truck. Stock the trucks with the parts those trips waited on.
$33,500of finished work is more than a week old and not yet invoiced, 13 jobs. Invoice those 13 jobs this week.
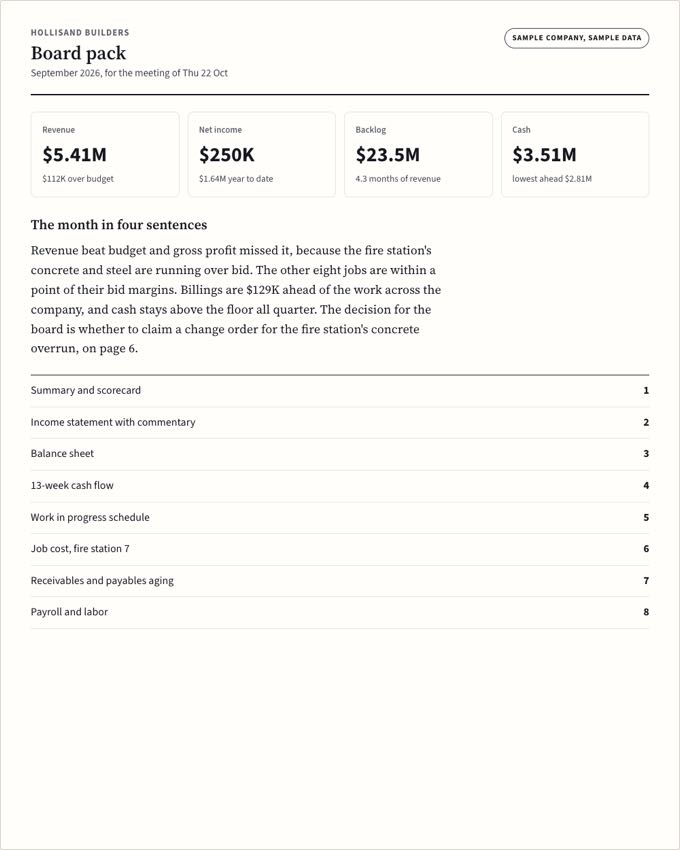
Hollisand Builders
Monday report
September close, cash to Sun 18 Oct
Sample: a commercial builder
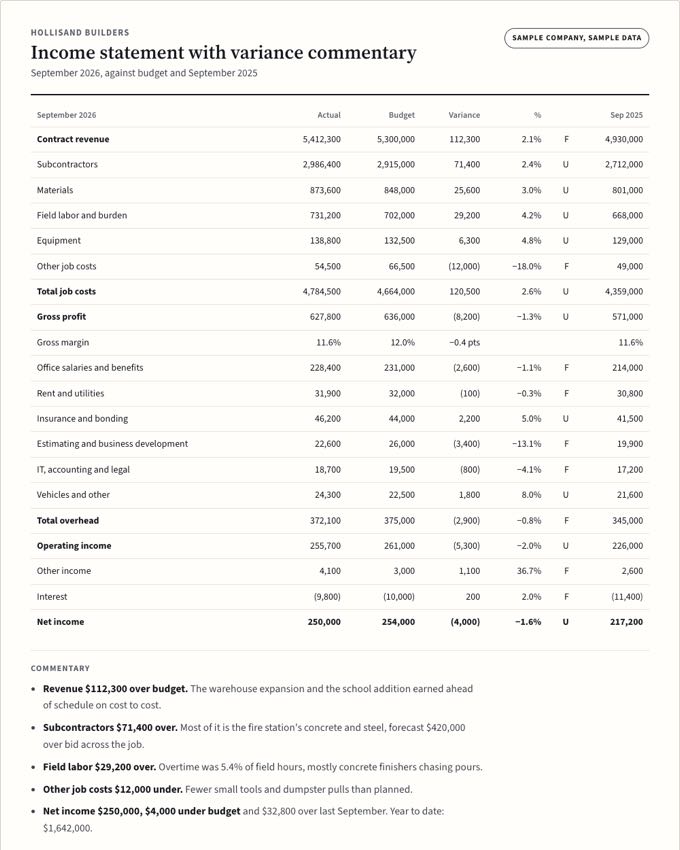
More work, thinner margin. September revenue beat budget by $112,300, yet net income missed by $4,000: gross margin was 11.6% against 12.0%. Most of the fade is one job. In the bank: 2.8 weeks of payments, with a 13-week low of $2,810,000 the week of Dec 28.
Profit and loss against budget
Actual
Budget
Var.
Contract revenue
5,412,300
5,300,000
+112,300
Job costs
4,784,500
4,664,000
(120,500)
Overhead
372,100
375,000
+2,900
Interest, net
5,700
7,000
+1,300
Net income
250,000
254,000
(4,000)
Cash in bank
$3,840,000
Low point $2,810,000, week of Dec 28
Backlog, 12 month ends
$23.5M
$1.7M less than in August
Needs a decision
$420,000Fire station 7 is forecast over its bid at 50% complete. Its margin drops from 11.9% to 7.3%, most of it in concrete, steel and interiors. Price the change orders before interiors are bought out.
$285,988of work on the school addition is done and not billed. At 62% complete, it is running $50,000 over its bid. Bill it on the October pay application.
$676,000of retention on the medical office building comes due at closeout, and that job is 90% complete. Start the punch list now.
An illustration with sample figures from four invented companies. No client data.
What we build
Finance systems, bridge software, dashboards, apps and websites
Who we build for
Manufacturers, builders, restaurants and service companies
Our standard
A bridge built for your company that closes the gaps between your data and your operations
How we start
A written scope before any work
About
Built by someone who has had to answer for the number.
A corporate controller and CFO started Vivid, not an agency looking for billable hours. He spent his career in the finance office, where the signature work was moving the books and payroll onto a new platform while the month still had to close.
You notice the difference in the first week. Nobody here needs it explained what a WIP schedule is, why food cost looks wrong, or what happens when two people can ring the same item at two different prices.
One firm covers the whole build: the database, the server, the app and the screen you read. Nothing is handed to a subcontractor halfway through.
We have sat in the chair. The software gets built for the person who has to answer for the number.
Your numbers
You should not have to wait on someone stretched thin to know how the business did yesterday.
The numbers already exist. They sit in the ERP, the payroll provider, the point of sale and the bank, and somebody pulls them together when there is time. There rarely is, so the owner finds out late.
We connect those systems, tie every figure to the general ledger, and have the reports ready each morning before you are. You read them yourself, and they match the books.
Data in, reports out
What we connect, and what you get.
Data in: what you already pay for
Reports out
Vivid's layer
We pull the data. A data pipeline: scheduled jobs copy each system's figures out every night, so nobody exports a spreadsheet.
We clean it and tie it to the general ledger. A data warehouse: one database where every figure is checked against the books. One source of truth.
You read the reports. Business intelligence (BI): dashboards and reports built on that one source, there when you sit down.
Pick a system on the left or a report on the right, and the path it takes lights up.
ERP and general ledger. The chart of accounts, every journal entry, every invoice and bill. It feeds all nine reports, and every other figure is tied back to it before anyone reads it.
Payroll. Hours, wages, burden and the payroll calendar. Labor is the largest cost most owners have, so it shows up in six of the nine reports.
Point of sale. Sales by day and by item, comps and voids. Daily sales land in the P&L, the labor percent and the scorecard the next morning.
Bank feeds. Deposits, payments and balances from the bank itself. Cash on the reports is the bank's number, not a guess.
CRM. Customers, quotes and expected payments. Collections notes and the sales pipeline feed the cash forecast and the aging.
Spreadsheets. The budget, job estimates and schedules that live in spreadsheets today. They are read as they are, then checked like everything else.
Monthly P&L. Built from the general ledger, Point of sale and Spreadsheets. See the sample report
13-week cash. Built from Bank feeds, the general ledger, Payroll, CRM and Spreadsheets. See the sample report
AR and AP aging. Built from the general ledger, Bank feeds and CRM. See the sample report
WIP schedule. Built from the general ledger, Spreadsheets and Payroll. See the sample report
Job costing. Built from the general ledger, Payroll and Spreadsheets. See the sample report
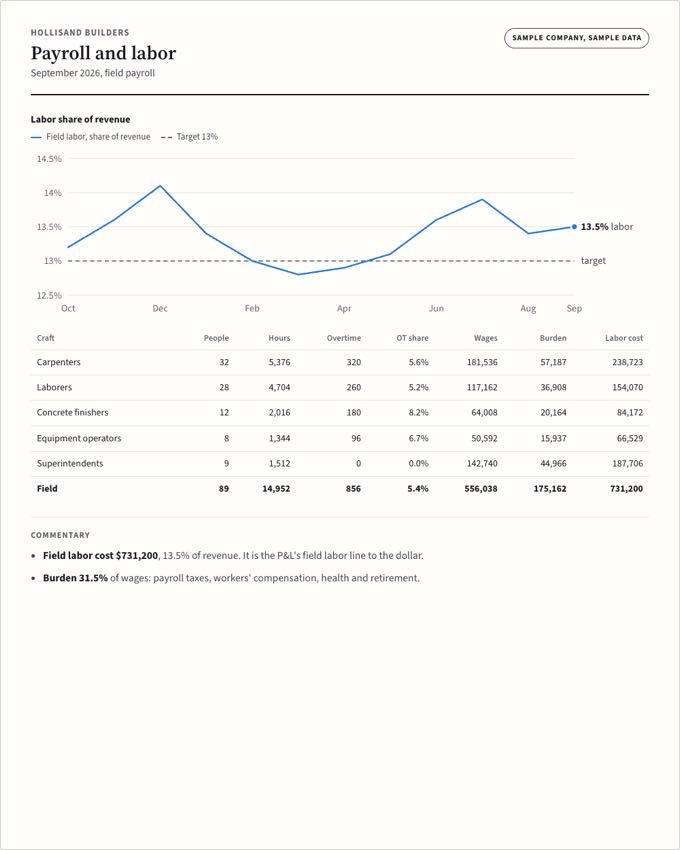
Payroll and labor %. Built from Payroll, the general ledger and Point of sale. See the sample report
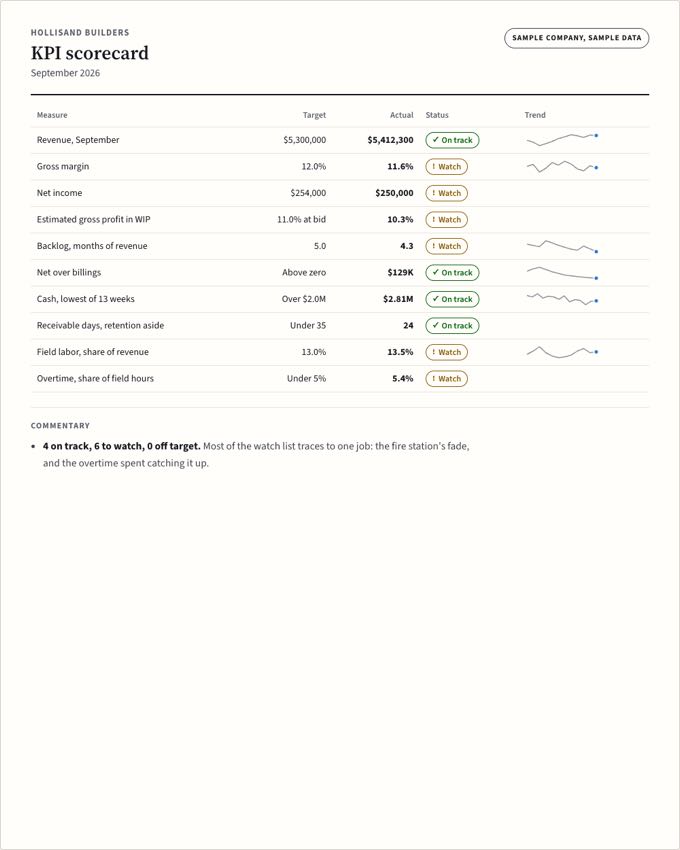
KPI scorecard. Built from the general ledger, Payroll, Point of sale, Bank feeds and CRM. See the sample report
Board pack. Built from the general ledger, Payroll, Point of sale, Bank feeds, CRM and Spreadsheets. See the sample report
See it for your trade
Operational oversight, built on the books.
Four invented companies with sample books that add up. Pick a trade. Every tile opens the report behind it, every chart shows its figures on hover, and every report has a table.
Veltrane Components veltrane.example
Contract machining and fabrication. One plant, three lines, 140 people.
Sample company, sample data
Books through Sun 18 Oct. Refreshed Mon 19 Oct 2026, 6:00 AM. From ERP, Payroll, Shop floor, Bank.
Overview
The first screen every morning
Three things to look at today
Fabrication and weld ran at 88% of its standard rate last week, the fifth week in a row under 95%.
Scrap is 3.1% of material this month against a 2.5% allowance. The excess is $5,088.
Cash bottoms at $1.33M the week of Jan 4. Receivables over 60 days total $198K.
Revenue by month
Month
September
Gross margin
Gross margin
Budget 25.5%
Show the figures as a table
Month
Revenue
Gross margin
Oct
$3,180,000
24.8%
Nov
$2,960,000
24.1%
Dec
$2,710,000
22.9%
Jan
$3,040,000
23.6%
Feb
$3,120,000
24.4%
Mar
$3,390,000
25.3%
Apr
$3,310,000
25.0%
May
$3,460,000
25.8%
Jun
$3,280,000
24.6%
Jul
$3,150,000
23.9%
Aug
$3,370,000
25.1%
Sep
$3,420,000
24.2%
13-week cash forecast
Ending cash
Lowest week
Floor, $1.0M
Receivables by age, $4.62M
Current
1 to 30
31 to 60
61 to 90
Over 90
Conversion cost per unit
October to date, 13 production days
Over or under standard, per unit
Over standard
Under standard
Line
Units
Labor applied
Overhead applied
Labor actual
Overhead actual
Under (over) applied
Per unit
Standard
CNC machining
12,960
49,896
80,352
51,830
85,410
6,992
$10.59
$10.05
Fabrication and weld
5,720
36,608
40,612
39,950
47,180
9,910
$15.23
$13.50
Assembly
8,640
36,288
28,512
35,410
28,960
(430)
$7.45
$7.50
Plant
27,320
122,792
149,476
127,190
161,550
16,472
$10.57
$9.97
What it says. Labor and overhead cost $16,472 more than the standard rates applied to the 27,320 units made. Fabrication and weld carries $9,910 of it, $1.73 a unit, because its overhead was spread over fewer units than planned.
Material yield and scrap
October to date, 13 production days
Scrap by week
Scrap, % of material issued
Allowance 2.5%
Line
Material issued
Scrap
Scrap %
Yield
CNC machining
412,600
9,900
2.4%
97.6%
Fabrication and weld
268,400
13,150
4.9%
95.1%
Assembly
188,300
3,770
2.0%
98.0%
Plant
869,300
26,820
3.1%
96.9%
What it says. Scrap is 3.1% of the $869,300 of material issued, against a 2.5% allowance: $5,088 of material over standard. Fabrication and weld scrapped 4.9%.
Standard against actual cost
October to date, 13 production days
Variance by cause
Favorable
Unfavorable
Variance
Amount
Material price
6,140
U
Material usage
5,088
U
Labor rate
2,310
F
Labor efficiency
6,708
U
Overhead spending
4,860
U
Overhead volume
7,214
U
Total, unfavorable
27,700
U
Cost of sales
Amount
At standard
1,445,300
Variances
27,700
Actual, as booked
1,473,000
What it says. Actual cost of sales is $1,473,000: $1,445,300 at standard plus $27,700 of variance. That variance is the 1.4-point gap to budgeted gross margin. Overhead volume, $7,214, is the largest piece.
Throughput by line
13 weeks to Sun 18 Oct
Units per run hour, % of standard
CNC machining
Fabrication and weld
Assembly
Standard rate
Show the figures as a table
Week ending
Machining
Fab and weld
Assembly
Jul 26
97%
99%
96%
Aug 2
99%
98%
98%
Aug 9
101%
100%
99%
Aug 16
98%
97%
101%
Aug 23
100%
98%
100%
Aug 30
102%
96%
99%
Sep 6
99%
95%
102%
Sep 13
101%
96%
100%
Sep 20
100%
93%
101%
Sep 27
98%
92%
103%
Oct 4
101%
90%
100%
Oct 11
100%
89%
101%
Oct 18
99%
88%
102%
What it says. Fabrication and weld has run under 95% of its standard rate for 5 weeks straight, 88% last week. Machining and assembly are on standard.
Inventory turns
Trailing 12 months to September
Turns by month
Turns, trailing 12 months
Target 6.0
Inventory
On hand
Days of cost
Raw material
2,650,000
33
Work in process
1,100,000
14
Finished goods
1,380,000
17
Total
5,130,000
65
What it says. $5,130,000 on hand against $28,977,600 of cost of sales over 12 months: 5.6 turns, 65 days. Raw material is 33 of those days.
Budget against actual
October to date, 13 production days
Variance against budget
Favorable
Unfavorable
Line
Actual
Budget
Variance
%
Revenue
1,940,000
1,980,000
(40,000)
−2.0%
U
Cost of sales
1,473,000
1,475,100
(2,100)
−0.1%
F
Gross profit
467,000
504,900
(37,900)
−7.5%
U
Selling and admin
214,300
221,000
(6,700)
−3.0%
F
Operating income
252,700
283,900
(31,200)
−11.0%
U
What it says. Operating income is $31,200 under budget. Revenue is $40,000 short, and the cost variances take the rest. Selling and admin is $6,700 under.
13-week cash forecast
Starting cash $2,410,000, week of Oct 19
Ending cash
Lowest week
Cash floor, $1.0M
Week of
Starting cash
Cash in
Cash out
Net
Ending cash
Oct 19
2,410,000
812,000
905,000
(93,000)
2,317,000
Oct 26
2,317,000
768,000
742,000
26,000
2,343,000
Nov 2
2,343,000
845,000
1,010,000
(165,000)
2,178,000
Nov 9
2,178,000
790,000
760,000
30,000
2,208,000
Nov 16
2,208,000
802,000
980,000
(178,000)
2,030,000
Nov 23
2,030,000
655,000
810,000
(155,000)
1,875,000
Nov 30
1,875,000
836,000
744,000
92,000
1,967,000
Dec 7
1,967,000
810,000
990,000
(180,000)
1,787,000
Dec 14
1,787,000
788,000
765,000
23,000
1,810,000
Dec 21
1,810,000
842,000
1,012,000
(170,000)
1,640,000
Dec 28
1,640,000
590,000
735,000
(145,000)
1,495,000
Jan 4
1,495,000
860,000
1,020,000
(160,000)
1,335,000
Jan 11
1,335,000
815,000
770,000
45,000
1,380,000
13 weeks
2,410,000
10,213,000
11,243,000
(1,030,000)
1,380,000
What it says. Cash bottoms at $1.33M the week of Jan 4, $335K above the floor. Behind the dip: the quarter-end tax payment and two payroll weeks back to back.
Receivables aging
At Sun 18 Oct
Current
1 to 30
31 to 60
61 to 90
Over 90
Days
Amount
Share
Current
3,050,000
66.0%
1 to 30
1,010,000
21.9%
31 to 60
362,000
7.8%
61 to 90
128,000
2.8%
Over 90
70,000
1.5%
Total
4,620,000
100.0%
What it says. $198K is over 60 days, 4.3% of $4.62M.
Saltmarrow Kitchen saltmarrow.example
Three full-service restaurants and a catering kitchen. 210 people.
Sample company, sample data
Books through Sun 18 Oct. Refreshed Mon 19 Oct 2026, 6:00 AM. From POS, Payroll, Inventory counts, Bank.
Overview
The first screen every morning
Three things to look at today
Food cost ran 30.0% last week against 28.1% theoretical: $4,109 of product the recipes cannot account for.
Westside ran a 65.5% prime cost, 5.5 pts over target.
Late night labor is 32.2% of its sales, against 23.4% at dinner.
Net sales by month
Month
September
Gross margin
Gross margin
Budget 70.5%
Show the figures as a table
Month
Revenue
Gross margin
Oct
$944,000
70.2%
Nov
$902,000
70.6%
Dec
$1,046,000
69.4%
Jan
$868,000
70.9%
Feb
$905,000
70.8%
Mar
$1,012,000
70.1%
Apr
$986,000
69.8%
May
$1,041,000
69.5%
Jun
$1,003,000
69.9%
Jul
$1,025,000
69.2%
Aug
$958,000
69.6%
Sep
$931,000
70.3%
13-week cash forecast
Ending cash
Lowest week
Floor, $150.0K
Payables by age, $72.2K
Current
1 to 30
31 to 60
61 to 90
Over 90
Food and beverage cost against theoretical
Daily, 14 days to Sun 18 Oct
Cost as a share of sales
Actual, from counts
Theoretical, from recipes and items sold
Day
Net sales
Actual
Theoretical
Gap
Mon Oct 12
21,500
30.6%
28.3%
495
Tue Oct 13
22,000
29.8%
28.1%
374
Wed Oct 14
24,300
30.4%
28.4%
486
Thu Oct 15
27,500
29.7%
28.2%
413
Fri Oct 16
36,900
29.2%
28.0%
443
Sat Oct 17
50,060
29.4%
27.9%
751
Sun Oct 18
39,600
31.2%
28.3%
1,148
Week
221,860
30.0%
28.1%
4,109
What it says. Last week ran 30.0% against 28.1% theoretical: $4,109 of product the recipes cannot account for. Sunday alone was 2.9 pts over.
Prime cost
Weekly, 13 weeks to Sun 18 Oct
Prime cost by week
Prime cost
Target 60%
Restaurant
Net sales
Food and beverage
Labor
Prime cost
Status
Harborside
90,963
26,741
28,057
60.2%
◆Watch
Midtown
75,432
22,326
23,714
61.0%
◆Watch
Westside
55,465
17,470
18,862
65.5%
✕Off target
All three
221,860
66,537
70,633
61.8%
What it says. Westside ran a 65.5% prime cost last week, 5.5 pts over target and the highest of the three.
Labor by daypart
Week of Mon 12 Oct to Sun 18 Oct
Hourly labor, share of sales
Daypart
Net sales
Hours
Hourly labor
Labor %
Brunch
26,400
436
7,151
27.1%
Lunch
48,200
900
14,309
29.7%
Dinner
131,500
1,802
30,814
23.4%
Late
15,760
323
5,072
32.2%
Week
221,860
3,461
57,346
25.8%
What it says. Late night spends 32.2% of its sales on hourly labor, dinner 23.4%. Management and payroll taxes add $13,287 to reach 31.8% all in.
Sales per labor hour
Week of Mon 12 Oct to Sun 18 Oct
Sales per labor hour
Lower Higher. Blank: closed.
Daypart
Net sales
Hours
Per hour
Brunch
26,400
436
$60.55
Lunch
48,200
900
$53.56
Dinner
131,500
1,802
$72.97
Late
15,760
323
$48.79
Week
221,860
3,461
$64.10
What it says. Across the week: $64.10 an hour. Weakest shift: Sun late, $36.67.
Menu mix and margin
Week of Mon 12 Oct to Sun 18 Oct
Popularity and margin
Item
Sold
Mix
Price
Food cost
Margin
Class
Shrimp and grits
642
12.3%
$24.00
$7.10
$16.90
Star
Smash burger
905
17.4%
$17.00
$5.20
$11.80
Plowhorse
Ribeye, 14 oz
286
5.5%
$46.00
$19.70
$26.30
Puzzle
Fish tacos
588
11.3%
$18.00
$5.90
$12.10
Plowhorse
Grilled grouper
344
6.6%
$34.00
$13.80
$20.20
Star
Chicken sandwich
512
9.8%
$16.00
$4.40
$11.60
Plowhorse
Braised short rib
198
3.8%
$32.00
$10.60
$21.40
Puzzle
Fried green tomatoes
455
8.7%
$12.00
$2.70
$9.30
Plowhorse
Crab cakes
236
4.5%
$29.00
$11.90
$17.10
Puzzle
Caesar salad
401
7.7%
$13.00
$3.10
$9.90
Plowhorse
Mahi bowl
268
5.1%
$21.00
$8.40
$12.60
Dog
Key lime pie
377
7.2%
$9.00
$1.90
$7.10
Plowhorse
What it says. Shrimp and grits and Grilled grouper sell well and earn above the $13.73 average. The mahi bowl does neither: reprice it, rework it or take it off.
Waste
Week of Mon 12 Oct to Sun 18 Oct
Waste, share of purchases
Category
Purchases
Waste
Share
Seafood
15,900
960
6.0%
Produce
9,800
820
8.4%
Proteins
18,200
640
3.5%
Bakery
3,100
310
10.0%
Dairy
4,300
220
5.1%
Bar
14,600
210
1.4%
All
65,900
3,160
4.8%
What it says. $3,160 logged as waste, 4.8% of purchases, up from 3.9% in July. Bakery and produce lose the largest share.
Budget against actual
Week of Mon 12 Oct to Sun 18 Oct
Variance against budget
Favorable
Unfavorable
Line
Actual
Budget
Variance
%
Net sales
221,860
214,000
7,860
3.7%
F
Food and beverage cost
66,537
61,700
4,837
7.8%
U
Labor, all in
70,633
68,900
1,733
2.5%
U
Occupancy
16,800
16,800
0
0.0%
Other operating
30,200
29,400
800
2.7%
U
Restaurant profit
37,690
37,200
490
1.3%
F
What it says. Sales beat budget by $7,860, and food cost and labor took $6,570 of it back. Restaurant profit ended $490 over.
13-week cash forecast
Starting cash $486,000, week of Oct 19
Ending cash
Lowest week
Cash floor, $150.0K
Week of
Starting cash
Cash in
Cash out
Net
Ending cash
Oct 19
486,000
212,000
238,000
(26,000)
460,000
Oct 26
460,000
218,000
196,000
22,000
482,000
Nov 2
482,000
214,000
252,000
(38,000)
444,000
Nov 9
444,000
209,000
201,000
8,000
452,000
Nov 16
452,000
226,000
244,000
(18,000)
434,000
Nov 23
434,000
241,000
212,000
29,000
463,000
Nov 30
463,000
205,000
236,000
(31,000)
432,000
Dec 7
432,000
222,000
205,000
17,000
449,000
Dec 14
449,000
236,000
256,000
(20,000)
429,000
Dec 21
429,000
268,000
231,000
37,000
466,000
Dec 28
466,000
252,000
262,000
(10,000)
456,000
Jan 4
456,000
198,000
214,000
(16,000)
440,000
Jan 11
440,000
206,000
232,000
(26,000)
414,000
13 weeks
486,000
2,907,000
2,979,000
(72,000)
414,000
What it says. Cash bottoms at $414K the week of Jan 11, $264K above the floor. Rent falls on the first Monday of each month; sales tax on the 20th.
Payables aging
At Sun 18 Oct
Current
1 to 30
31 to 60
61 to 90
Over 90
Days
Amount
Share
Current
41,200
57.1%
1 to 30
22,800
31.6%
31 to 60
6,300
8.7%
61 to 90
1,900
2.6%
Over 90
0
0.0%
Total
72,200
100.0%
Vendor type
Open
Broadline food distributor
28,400
Seafood supplier
14,900
Beer and wine distributors
11,600
Produce supplier
7,300
Linen service
2,900
Repairs and maintenance
7,100
Total
72,200
What it says. $72,200 open to vendors, $8,200 of it past 30 days. Pay the seafood supplier first: it holds the shortest terms.
Corvalt Mechanical corvalt.example
HVAC and plumbing service, homes and light commercial. 34 technicians.
Sample company, sample data
Books through Sun 18 Oct. Refreshed Mon 19 Oct 2026, 6:00 AM. From Field service app, ERP, Payroll, Bank.
Overview
The first screen every morning
Three things to look at today
Utilization is 69.2% this month against a 75% target. Each point is about $10,134 of revenue so far.
76 of 134 return trips were for a part that was not on the truck.
$33,500 of finished work is more than a week old and not yet invoiced.
Revenue by month
Month
September
Gross margin
Gross margin
Budget 47.0%
Show the figures as a table
Month
Revenue
Gross margin
Oct
$1,092,000
47.1%
Nov
$1,018,000
46.4%
Dec
$1,124,000
45.8%
Jan
$1,206,000
46.9%
Feb
$1,084,000
47.6%
Mar
$1,102,000
48.0%
Apr
$1,146,000
47.4%
May
$1,238,000
46.8%
Jun
$1,324,000
45.9%
Jul
$1,388,000
45.2%
Aug
$1,356,000
45.6%
Sep
$1,210,000
46.7%
13-week cash forecast
Ending cash
Lowest week
Floor, $400.0K
Receivables by age, $1.50M
Current
1 to 30
31 to 60
61 to 90
Over 90
Revenue per technician
October to date, 13 working days
Revenue per billable hour
Technician
The other 22, together
Average
Show the figures as a table
Technician
Billable hours
Paid hours
Utilization
Revenue
Per hour
T-04
98
124
79.0%
30,576
$312
T-02
92
124
74.2%
27,692
$301
T-11
94
122
77.0%
27,824
$296
T-17
90
120
75.0%
25,560
$284
T-08
88
124
71.0%
23,848
$271
T-21
86
118
72.9%
22,876
$266
T-06
84
124
67.7%
21,756
$259
T-14
82
120
68.3%
20,336
$248
T-19
80
124
64.5%
18,880
$236
T-25
76
120
63.3%
17,024
$224
T-23
72
116
62.1%
15,192
$211
T-30
64
112
57.1%
12,288
$192
Other 22
1,712
2,480
69.0%
437,408
$255
All 34
2,718
3,928
69.2%
701,260
$258
What it says. Technicians billed 2,718 hours for $701,260, $258 an hour. T-04 earns $312 an hour, T-30 earns $192: a ride-along is cheaper than a hire.
Utilization
13 weeks to Sun 18 Oct
Utilization by week
Billable share of paid hours
Target 75%
Show the figures as a table
Week ending
Utilization
Jul 26
74%
Aug 2
75%
Aug 9
77%
Aug 16
76%
Aug 23
73%
Aug 30
72%
Sep 6
74%
Sep 13
73%
Sep 20
71%
Sep 27
72%
Oct 4
70%
Oct 11
69%
Oct 18
69%
What it says. 69.2% this month against 75%. Each point is about $10,134 of revenue so far this month, at $258 a billable hour.
Job margin by type
October to date, 13 working days
Margin after labor and parts
Job type
Revenue
Labor
Parts and equipment
Margin
%
Replacement and install
286,400
41,200
128,700
116,500
40.7%
Repair, HVAC
148,900
38,600
31,100
79,200
53.2%
Repair, plumbing
94,700
24,900
16,800
53,000
56.0%
Maintenance agreements
71,300
26,100
6,200
39,000
54.7%
Commercial service
99,960
27,400
26,300
46,260
46.3%
All jobs
701,260
158,200
209,100
333,960
47.6%
What it says. Replacements bring in 40.8% of revenue at 40.7%. Plumbing repair earns the most on the dollar, 56.0%.
Fixed on the first visit
October to date, 13 working days
By weekWhy 134 jobs needed a second trip
Job type
Visits
Fixed first time
Rate
Replacement and install
44
41
93.2%
Repair, HVAC
412
338
82.0%
Repair, plumbing
286
247
86.4%
Maintenance agreements
538
517
96.1%
Commercial service
118
94
79.7%
All
1,398
1,237
88.5%
What it says. 76 of the 134 return trips were for a part that was not on the truck. Commercial service is lowest at 79.7%.
Work done, not yet invoiced
At Sun 18 Oct
Unbilled, by age
Since completion
Jobs
Amount
Done 0 to 2 days
46
61,400
Done 3 to 7 days
22
47,300
Done 8 to 14 days
9
21,900
Done 15 days or more
4
11,600
Total
81
142,200
What it says. $33,500 across 13 jobs is more than a week old. Every day it waits is a day added to the time it takes to collect.
Receivable days and aging
At Sun 18 Oct
Days of sales outstandingReceivables by age
Current
1 to 30
31 to 60
61 to 90
Over 90
Days
Amount
Current
862,000
1 to 30
388,000
31 to 60
154,000
61 to 90
61,000
Over 90
35,000
Total
1,500,000
What it says. 38 days of sales are waiting to be collected, $1,500,000. Commercial accounts hold most of the $96.0K past 60 days.
Budget against actual
October to date, 13 working days
Variance against budget
Favorable
Unfavorable
Line
Actual
Budget
Variance
%
Revenue
701,260
718,000
(16,740)
−2.3%
U
Labor and parts
367,300
384,100
(16,800)
−4.4%
F
Gross profit
333,960
333,900
60
0.0%
F
Office, trucks and admin
198,400
192,000
6,400
3.3%
U
Operating income
135,560
141,900
(6,340)
−4.5%
U
What it says. Revenue is $16,740 short of budget and overhead $6,400 over, so operating income trails by $6,340.
13-week cash forecast
Starting cash $1,184,000, week of Oct 19
Ending cash
Lowest week
Cash floor, $400.0K
Week of
Starting cash
Cash in
Cash out
Net
Ending cash
Oct 19
1,184,000
284,000
338,000
(54,000)
1,130,000
Oct 26
1,130,000
312,000
262,000
50,000
1,180,000
Nov 2
1,180,000
296,000
344,000
(48,000)
1,132,000
Nov 9
1,132,000
301,000
268,000
33,000
1,165,000
Nov 16
1,165,000
276,000
331,000
(55,000)
1,110,000
Nov 23
1,110,000
214,000
255,000
(41,000)
1,069,000
Nov 30
1,069,000
318,000
342,000
(24,000)
1,045,000
Dec 7
1,045,000
305,000
266,000
39,000
1,084,000
Dec 14
1,084,000
292,000
338,000
(46,000)
1,038,000
Dec 21
1,038,000
288,000
261,000
27,000
1,065,000
Dec 28
1,065,000
196,000
330,000
(134,000)
931,000
Jan 4
931,000
302,000
292,000
10,000
941,000
Jan 11
941,000
311,000
340,000
(29,000)
912,000
13 weeks
1,184,000
3,695,000
3,967,000
(272,000)
912,000
What it says. Cash bottoms at $912K the week of Jan 11, $512K above the floor. Two payrolls fall in the same week at the end of November and again at year end.
Hollisand Builders hollisand.example
Commercial general contractor. Nine active jobs, $63 million under contract.
Sample company, sample data
Books through Sun 18 Oct. Refreshed Mon 19 Oct 2026, 6:00 AM. From ERP job cost, Payroll, Project management, Bank.
Overview
The first screen every morning
Three things to look at today
Fire station 7 is forecast at 7.3% gross profit against 11.9% at bid. Concrete, structural steel, interiors and finishes carry most of the overrun.
Elementary school addition and Oakmont retail center are under billed by $570K between them.
Cash bottoms at $2.81M the week of Dec 28, $810K above the floor.
Revenue by month
Month
September
Gross margin
Gross margin
Budget 12.0%
Show the figures as a table
Month
Revenue
Gross margin
Oct
$4,810,000
11.8%
Nov
$4,560,000
12.1%
Dec
$4,120,000
10.9%
Jan
$4,380,000
11.5%
Feb
$4,650,000
12.4%
Mar
$5,020,000
12.0%
Apr
$5,240,000
12.6%
May
$5,510,000
12.2%
Jun
$5,380,000
11.4%
Jul
$5,160,000
11.1%
Aug
$5,470,000
11.9%
Sep
$5,412,000
11.6%
13-week cash forecast
Ending cash
Lowest week
Floor, $2.0M
Receivables by age, $4.35M
Current
1 to 30
31 to 60
61 to 90
Over 90
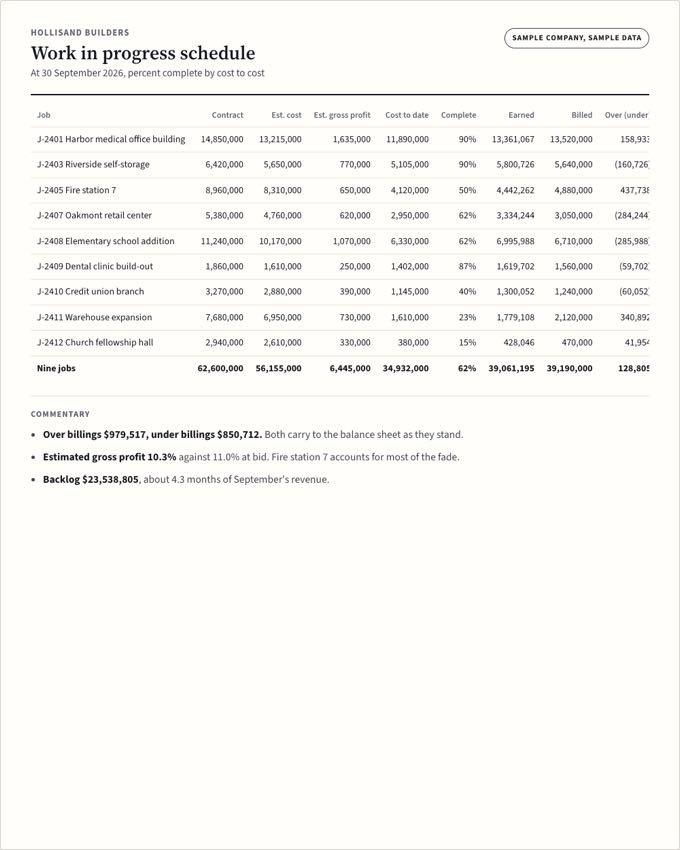
Work in progress schedule
At 30 Sep 2026, cost to cost
Over (under) billings
Over billed: billed ahead of the work
Under billed: work not yet billed
Job
Contract
Estimated cost
Cost to date
Complete
Earned
Billed
Over (under)
Gross profit
At bid
J-2401 Harbor medical office building
14,850,000
13,215,000
11,890,000
90%
13,361,067
13,520,000
158,933
11.0%
11.4%
J-2403 Riverside self-storage
6,420,000
5,650,000
5,105,000
90%
5,800,726
5,640,000
(160,726)
12.0%
11.2%
J-2405 Fire station 7
8,960,000
8,310,000
4,120,000
50%
4,442,262
4,880,000
437,738
7.3%
11.9%
J-2407 Oakmont retail center
5,380,000
4,760,000
2,950,000
62%
3,334,244
3,050,000
(284,244)
11.5%
11.0%
J-2408 Elementary school addition
11,240,000
10,170,000
6,330,000
62%
6,995,988
6,710,000
(285,988)
9.5%
10.0%
J-2409 Dental clinic build-out
1,860,000
1,610,000
1,402,000
87%
1,619,702
1,560,000
(59,702)
13.4%
12.9%
J-2410 Credit union branch
3,270,000
2,880,000
1,145,000
40%
1,300,052
1,240,000
(60,052)
11.9%
11.9%
J-2411 Warehouse expansion
7,680,000
6,950,000
1,610,000
23%
1,779,108
2,120,000
340,892
9.5%
9.4%
J-2412 Church fellowship hall
2,940,000
2,610,000
380,000
15%
428,046
470,000
41,954
11.2%
11.2%
Nine jobs
62,600,000
56,155,000
34,932,000
62%
39,061,195
39,190,000
128,805
10.3%
11.0%
What it says. Elementary school addition and Oakmont retail center are under billed by $570K between them: work done that has not been billed. Fire station 7 is billed $438K ahead of its work.
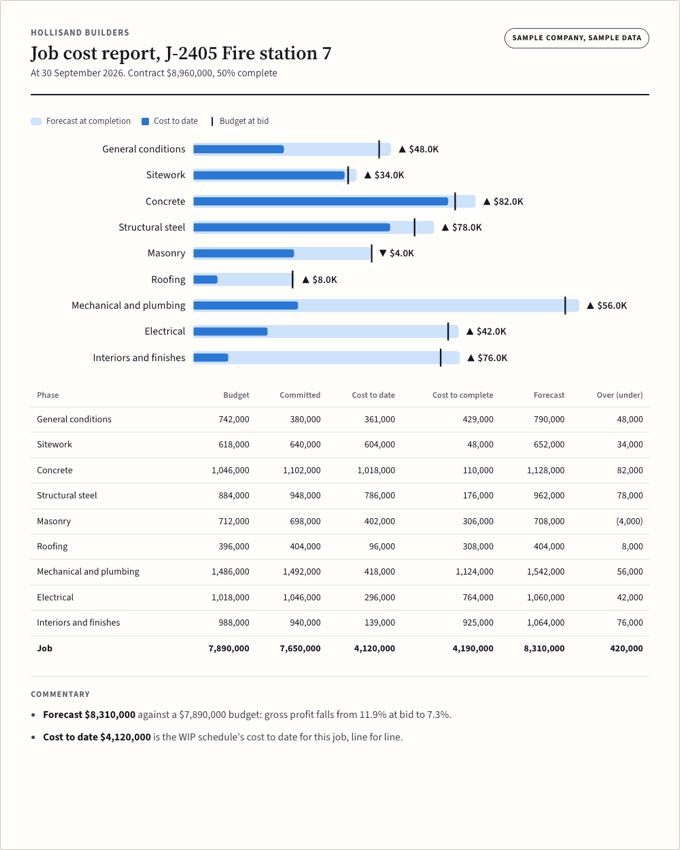
Job cost by phase, J-2405 Fire station 7
At 30 Sep 2026
Phase cost against budget
Forecast at completion
Cost to date
Budget at bid
Phase
Budget
Committed
Cost to date
Forecast
Over (under)
General conditions
742,000
380,000
361,000
790,000
48,000
Sitework
618,000
640,000
604,000
652,000
34,000
Concrete
1,046,000
1,102,000
1,018,000
1,128,000
82,000
Structural steel
884,000
948,000
786,000
962,000
78,000
Masonry
712,000
698,000
402,000
708,000
(4,000)
Roofing
396,000
404,000
96,000
404,000
8,000
Mechanical and plumbing
1,486,000
1,492,000
418,000
1,542,000
56,000
Electrical
1,018,000
1,046,000
296,000
1,060,000
42,000
Interiors and finishes
988,000
940,000
139,000
1,064,000
76,000
Job
7,890,000
7,650,000
4,120,000
8,310,000
420,000
What it says. Fire station 7 is forecast $420,000 over its bid, which takes gross profit from 11.9% to 7.3%. Concrete, structural steel, interiors and finishes carry $236,000 of it.
Committed against actual cost
At 30 Sep 2026
Cost by job
Estimated total cost
Cost to date
Committed: subcontracts and orders
Job
Estimated cost
Committed
Cost to date
Still to buy
J-2401 Harbor medical office building
13,215,000
12,940,000
11,890,000
275,000
J-2403 Riverside self-storage
5,650,000
5,480,000
5,105,000
170,000
J-2405 Fire station 7
8,310,000
7,650,000
4,120,000
660,000
J-2407 Oakmont retail center
4,760,000
4,310,000
2,950,000
450,000
J-2408 Elementary school addition
10,170,000
9,380,000
6,330,000
790,000
J-2409 Dental clinic build-out
1,610,000
1,540,000
1,402,000
70,000
J-2410 Credit union branch
2,880,000
2,410,000
1,145,000
470,000
J-2411 Warehouse expansion
6,950,000
5,870,000
1,610,000
1,080,000
J-2412 Church fellowship hall
2,610,000
1,920,000
380,000
690,000
Nine jobs
56,155,000
51,500,000
34,932,000
4,655,000
What it says. $51,500,000 is under subcontract or purchase order, 91.7% of estimated cost. $4,655,000 is still to buy, and that is where the margin is still at risk.
Retention
At 30 Sep 2026
Retention owed to us
Job
Owed to us
We owe subs
Net
J-2401 Harbor medical office building
676,000
498,000
178,000
J-2403 Riverside self-storage
282,000
214,000
68,000
J-2405 Fire station 7
488,000
296,000
192,000
J-2407 Oakmont retail center
305,000
168,000
137,000
J-2408 Elementary school addition
671,000
402,000
269,000
J-2409 Dental clinic build-out
78,000
52,000
26,000
J-2410 Credit union branch
124,000
71,000
53,000
J-2411 Warehouse expansion
212,000
96,000
116,000
J-2412 Church fellowship hall
47,000
18,000
29,000
Nine jobs
2,883,000
1,815,000
1,068,000
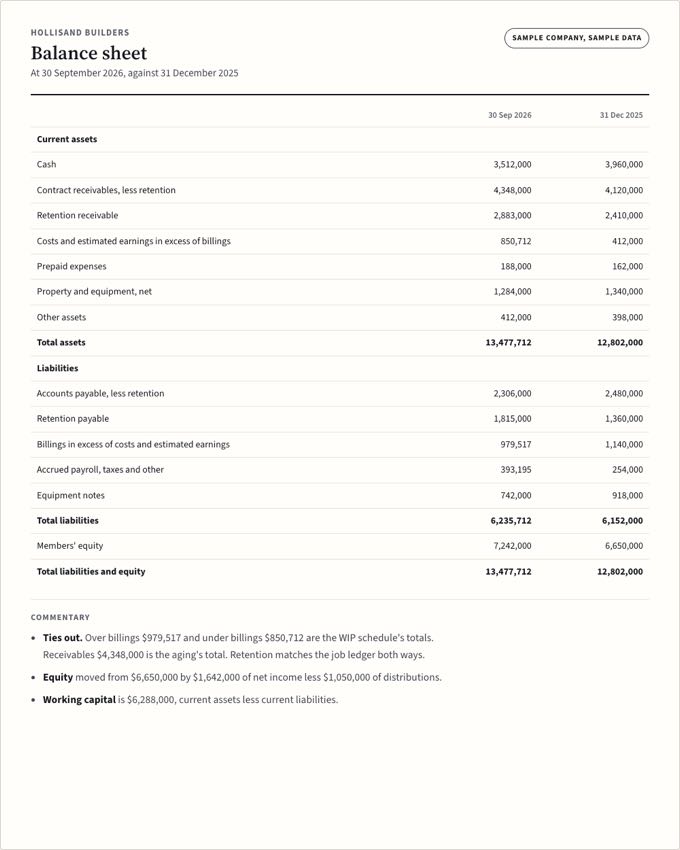
What it says. Owners hold $2,883,000 of ours and we hold $1,815,000 of the subs'. The medical office building is 90% complete: its $676K comes due at closeout.
Cash by job
Job to date, at 30 Sep 2026
Job cash position
Job has funded itself
Job is using our cash
Job
Cash received
Cash paid
Position
J-2401 Harbor medical office building
11,796,000
10,780,000
1,016,000
J-2403 Riverside self-storage
4,940,000
4,650,000
290,000
J-2405 Fire station 7
3,690,000
3,436,000
254,000
J-2407 Oakmont retail center
2,361,000
2,586,000
(225,000)
J-2408 Elementary school addition
5,143,000
5,404,000
(261,000)
J-2409 Dental clinic build-out
1,340,000
1,286,000
54,000
J-2410 Credit union branch
880,000
982,000
(102,000)
J-2411 Warehouse expansion
1,504,000
1,366,000
138,000
J-2412 Church fellowship hall
305,000
321,000
(16,000)
Nine jobs
31,959,000
30,811,000
1,148,000
What it says. 4 jobs are running on the company's cash, $604K together. The school addition is the largest, and it is also under billed.
Budget against actual
September 2026
Variance against budget
Favorable
Unfavorable
Line
Actual
Budget
Variance
%
Revenue
5,412,300
5,300,000
112,300
2.1%
F
Job costs
4,784,500
4,664,000
120,500
2.6%
U
Gross profit
627,800
636,000
(8,200)
−1.3%
U
Overhead
372,100
375,000
(2,900)
−0.8%
F
Net income
250,000
254,000
(4,000)
−1.6%
U
What it says. Revenue beat budget by $112,300 and gross profit missed by $8,200: margin was 11.6% against 12.0%. The fire station's fade is most of it.
13-week cash forecast
Starting cash $3,840,000, week of Oct 19
Ending cash
Lowest week
Cash floor, $2.0M
Week of
Starting cash
Cash in
Cash out
Net
Ending cash
Oct 19
3,840,000
1,210,000
1,380,000
(170,000)
3,670,000
Oct 26
3,670,000
1,640,000
1,290,000
350,000
4,020,000
Nov 2
4,020,000
980,000
1,460,000
(480,000)
3,540,000
Nov 9
3,540,000
1,420,000
1,210,000
210,000
3,750,000
Nov 16
3,750,000
1,580,000
1,640,000
(60,000)
3,690,000
Nov 23
3,690,000
1,110,000
1,390,000
(280,000)
3,410,000
Nov 30
3,410,000
1,690,000
1,310,000
380,000
3,790,000
Dec 7
3,790,000
860,000
1,520,000
(660,000)
3,130,000
Dec 14
3,130,000
1,520,000
1,280,000
240,000
3,370,000
Dec 21
3,370,000
1,380,000
1,470,000
(90,000)
3,280,000
Dec 28
3,280,000
610,000
1,080,000
(470,000)
2,810,000
Jan 4
2,810,000
1,740,000
1,360,000
380,000
3,190,000
Jan 11
3,190,000
1,460,000
1,410,000
50,000
3,240,000
13 weeks
3,840,000
17,200,000
17,800,000
(600,000)
3,240,000
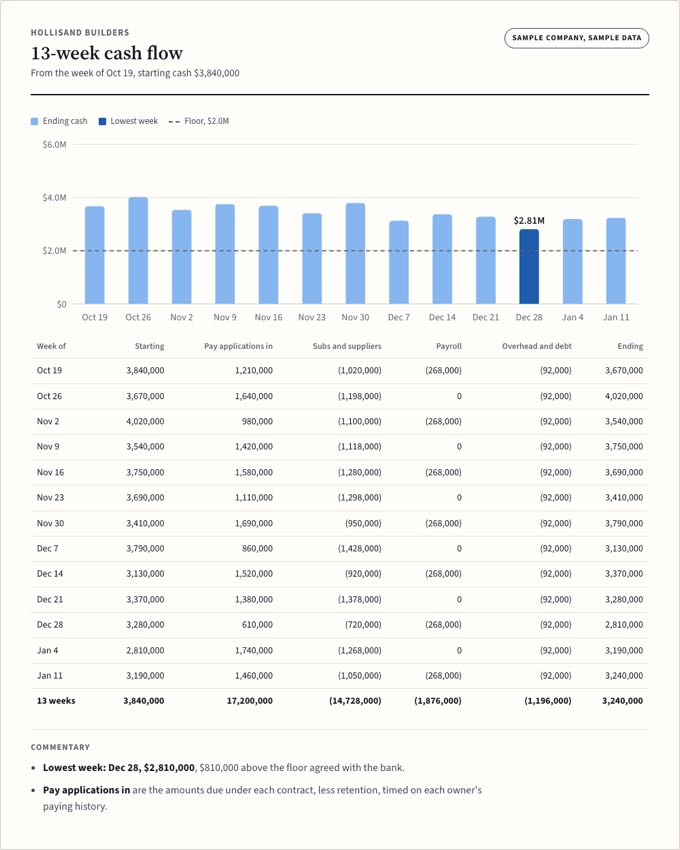
What it says. Cash bottoms at $2.81M the week of Dec 28, $810K above the floor. The week of Dec 28 holds two sub payments and a slow owner draw over the holidays.
Receivables aging
At 30 Sep 2026, retention not included
Current
1 to 30
31 to 60
61 to 90
Over 90
Days
Amount
Share
Current
2,774,000
63.8%
1 to 30
980,000
22.5%
31 to 60
412,000
9.5%
61 to 90
118,000
2.7%
Over 90
64,000
1.5%
Total
4,348,000
100.0%
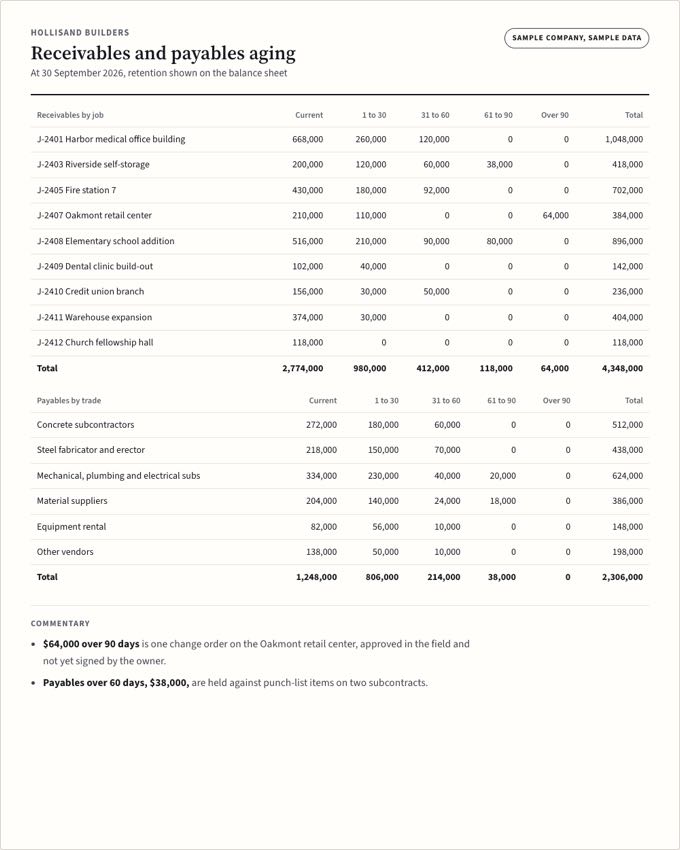
What it says. $182K is over 60 days. Retention, $2.88M, is tracked on its own report.
Sample companies and sample data. The names sit on reserved .example domains, and no figure comes from a client.
Want this for your business?
Tell us which systems you run and the one report you wish were waiting for you every morning. You'll get a written scope before anything is built, and it runs inside your own systems.
Nine reports from one sample contractor's September close, Hollisand Builders. They tie to each other the way real ones must: the balance sheet holds the WIP schedule's over and under billings, the aging and the retention. Each opens full size.
The books and payroll moved to a new platform, from the plan through the first close on it. It is the work the firm was founded on.
General ledgerPayrollJob costFirst close
Reporting, KPIs and BI
Reports that tie to the general ledger, and dashboards an owner and a controller both sign off on. Each runs on a core we maintain plus a settings file for your company.
Software that reads from the systems you already pay for and puts clean numbers where they get used. A system that can't be retired this year gets connected as it stands.
You keep the systems you have
Client portals
Sign in with a passkey or an authenticator code, with no password to steal. Files, tickets, agreements and invoices sit in one private place. Our own clients work in one.
PasskeysFilesTicketsInvoices
Business phone and texting
A line that rings every device, then the cell, then voicemail with a transcript. Texting built to carrier rules: consent recorded, and STOP, START and HELP answered. Our own line is 1-866-848-4374.
Mobile apps for iPhone and Android
PF Inventory is built for both, counted on a phone in the walk-in; its Android build is in Google Play testing. PostForged runs on iPhone.
Websites
Sites that load fast and that search engines can read. This one runs no scripts, sets no cookies and loads nothing from another host, and every chart on it is plain HTML and SVG.
No scriptsNo cookiesNo trackers
AI assistants that stay inside your rules
Ours draft and never send. They answer only from the facts they are given, never invent a price or a date, and nothing goes out until a person presses send.
A person presses send
A security review before anything ships
Nothing reaches production until it passes a review against a written security standard and an automated security gate.
Written standardAutomated gateDated record
Software
Products we build and run ourselves.
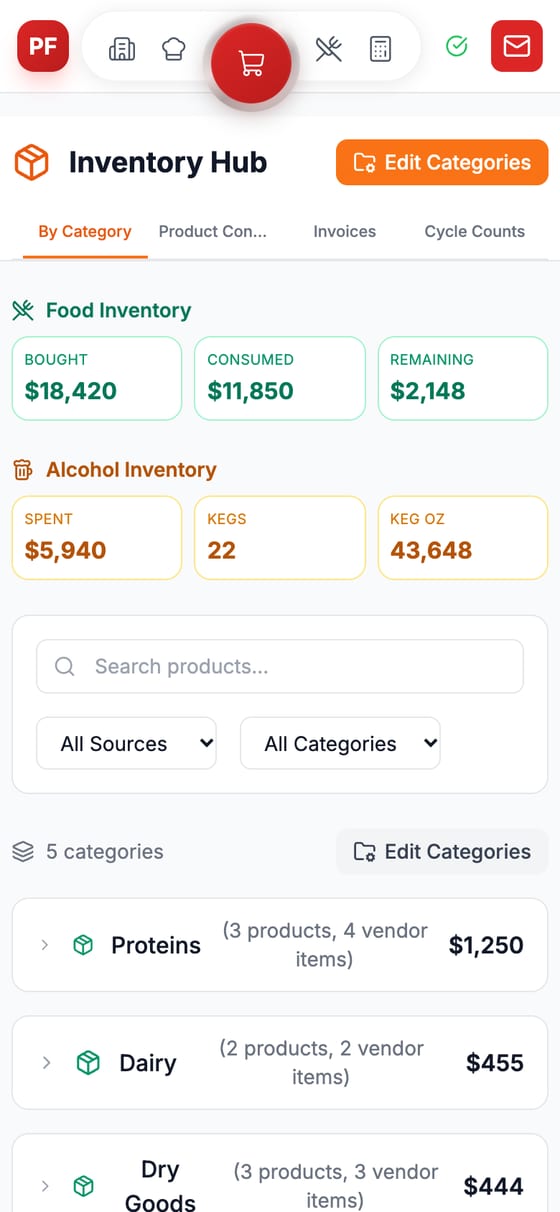
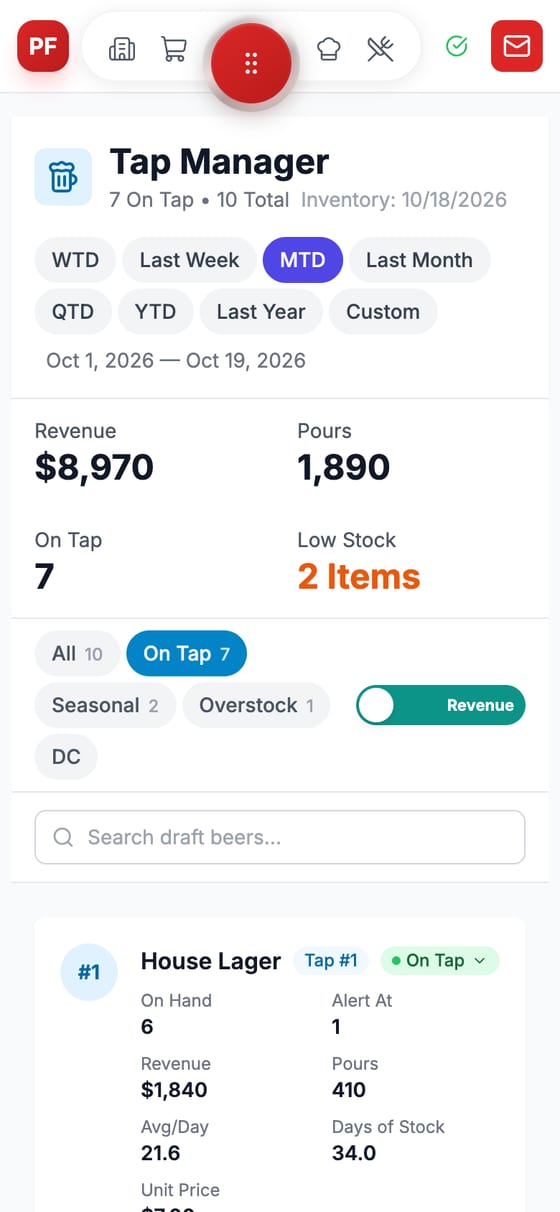
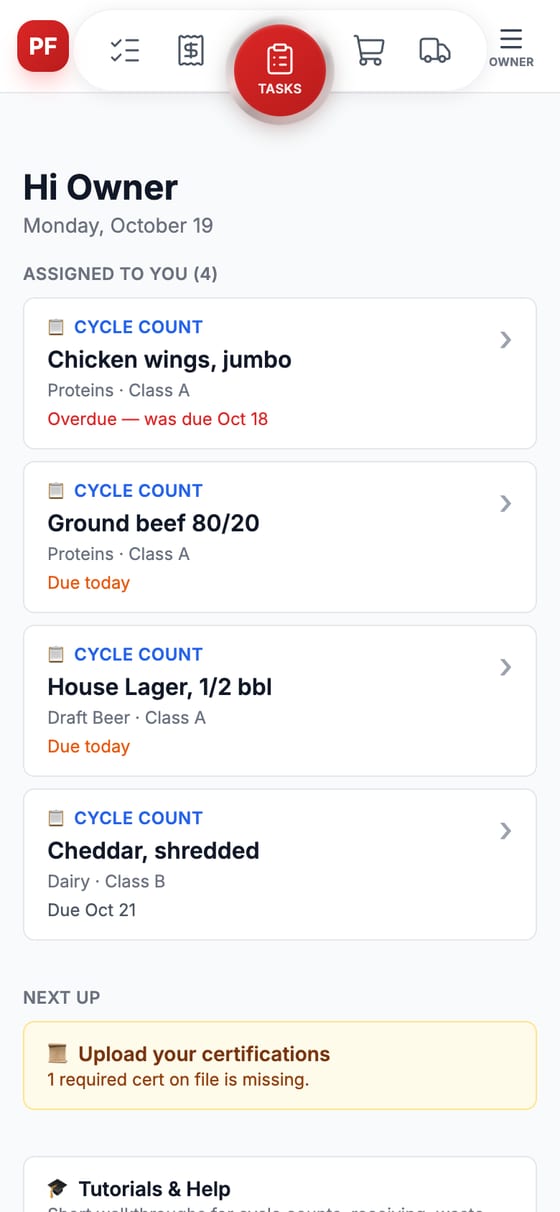
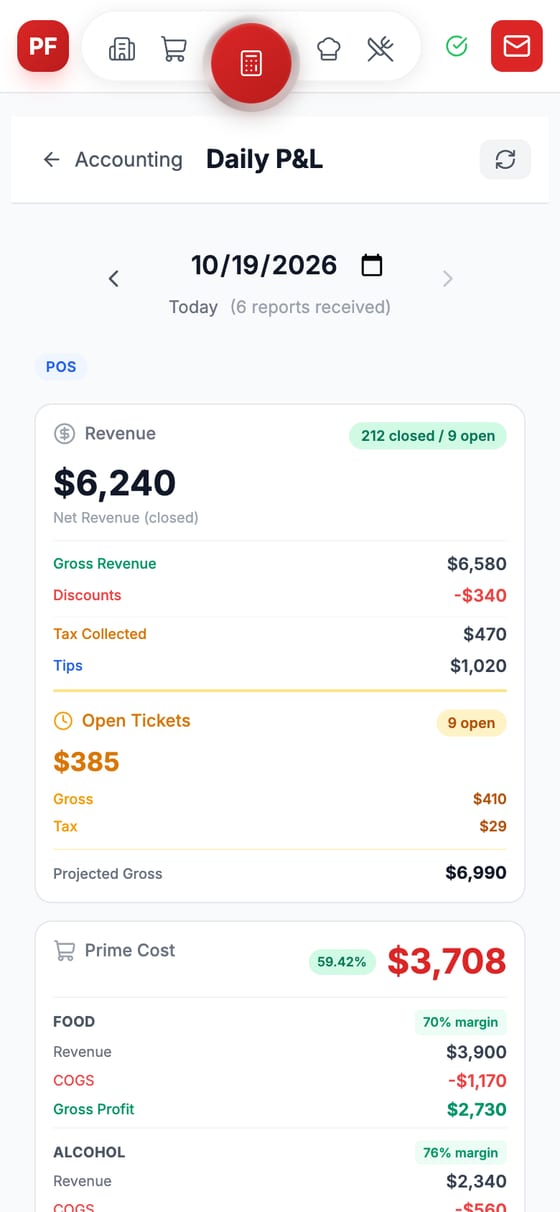
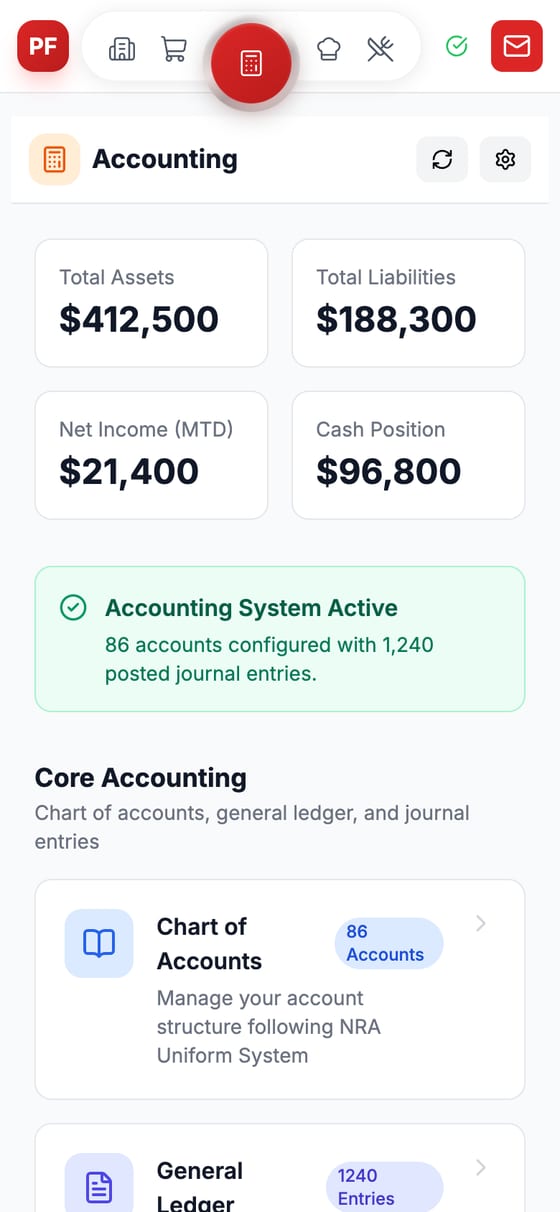
Two products of our own. Every screen below comes from the apps themselves, captured from their own builds with demo data.
ProfitForged
Accounts by request
Inventory, operations and accounting software for restaurants and bars, sold as three products: PF Inventory, PF Pulse and PF Books. Every module sits on one dial, the same one the app uses to move between them. Turn it. profitforged.com
Inventory. Counts, waste, deliveries and vendor orders, counted on a phone in the walk-in. Part of PF Inventory.
Bar Ops. Alcohol and keg inventory, counted on its own cycle. Part of PF Inventory.
Staffing. Employee profiles, time off, certifications and check requests. Part of PF Inventory.
Pulse. Daily P&L and KPIs, receipt scanning, and flags when a number moves out of its usual range. Sold as PF Pulse, not yet on sale.
Books. Chart of accounts, general ledger, payables, receivables, banking, reconciliation and payroll. Sold as PF Books, not yet on sale.
Tap a module, or use the arrow keys.
PostForged
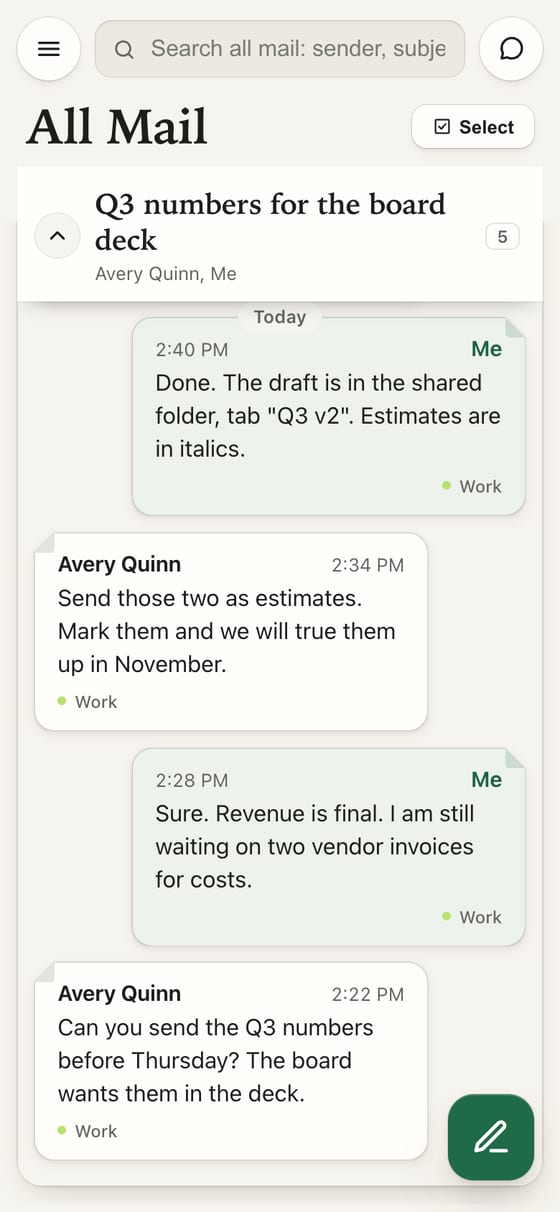
An email app for Gmail and Outlook. Mail is filed by tag instead of by folder, so one message can sit in every place it belongs. postforged.app
Conversations read like a text threadEach conversation is a stack of cards. Their messages sit to the left and yours to the right, and the reply bar stays under the thread.
One inbox, every accountGmail and Outlook mailboxes arrive in one list, and each mailbox files into its own tag by default.
Remote content off by defaultImages and other outside content in an email stay blocked until you load them, so a tracking pixel can't report that you opened it.
How we work
Five rules for every engagement.
1A written scope first
Every engagement starts with a written scope: what we will do, what it will take, and what you get at the end. Nothing starts until you approve it.
2The simplest option first
A proposal leads with the option that asks the least of your staff and keeps the least of your data. Heavier options follow, marked optional, with how long the numbers take to calculate.
3Your data stays yours
Builds run on sample files with your columns and none of your real records. Real data runs only inside your own systems.
4A portal for every client
Messages, previews to approve, agreements and invoices sit in one private place, so nothing important lives in a long email thread.
5Plain English
Answers come without jargon. When a technical term can't be avoided, it gets explained.
Founder
Who started Vivid.
Scott Day
Founder
A CFO who builds the software finance runs on.
Scott Day has been CFO or controller in manufacturing, construction and fiber, beverage distribution, healthcare operations and professional services. His signature work is the ERP and payroll migration. He started Vivid to take that work on directly, and to build the tools those jobs never had.
Seats held
CFO and controller, five industries
Migrations
ERP and payroll, on four platforms
Education
BS Accounting, MS Finance
Contact
What is your data not telling you?
Tell us what you run today and what you can't see in it. You'll hear back with the shortest path to something real, and whether we are the right people to build it.